Todo Nieve/Where the snow comes from
How a snowpack is measured, and by whom
The instruments are simple. The geography that makes them hard to reach is not.
Pillows, cores and the people who drive to them
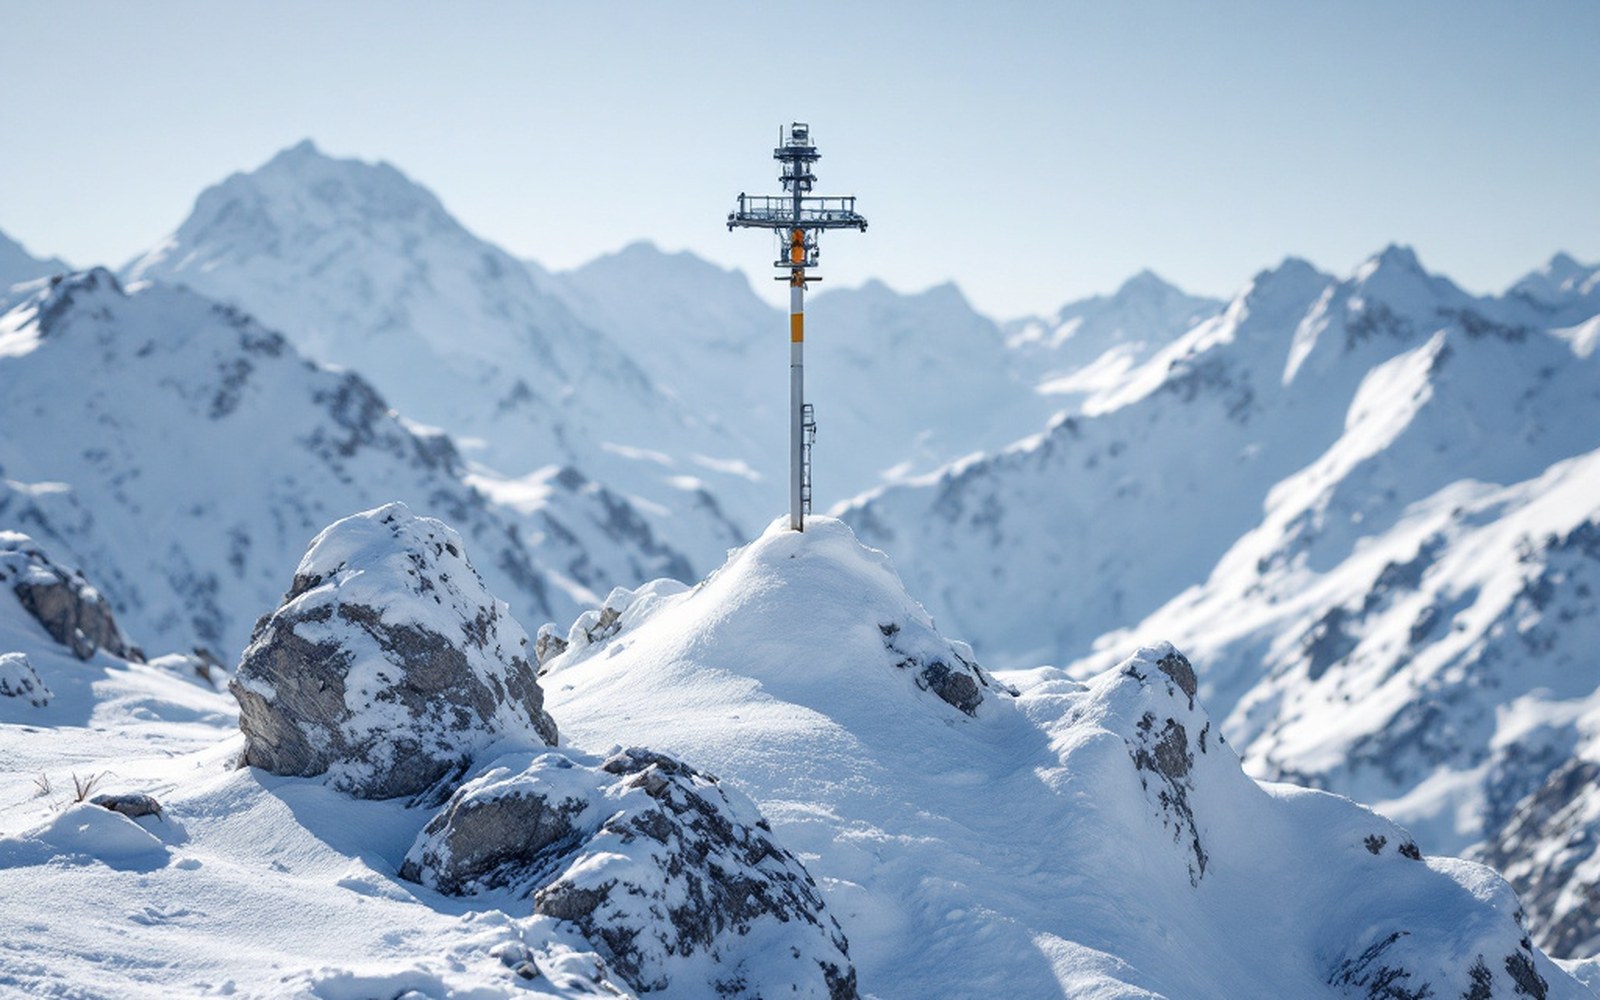
A snow pillow is a fluid-filled bladder buried beneath the surface of a snowfield, usually at elevation, connected to a pressure transducer that converts the weight of the overlying snow into a water-equivalent figure. No one has to visit it; it radios its reading in. The Instituto Nacional del Agua maintains a network of these across the Andean watershed, placed at sites chosen for their ability to represent broader catchment conditions rather than any particular valley. The figure that comes back is not snowpack depth — it is snow water equivalent: the volume of water locked in the column above the sensor, which is what matters for the rivers that drain east toward the pampas and west into Chilean valleys.
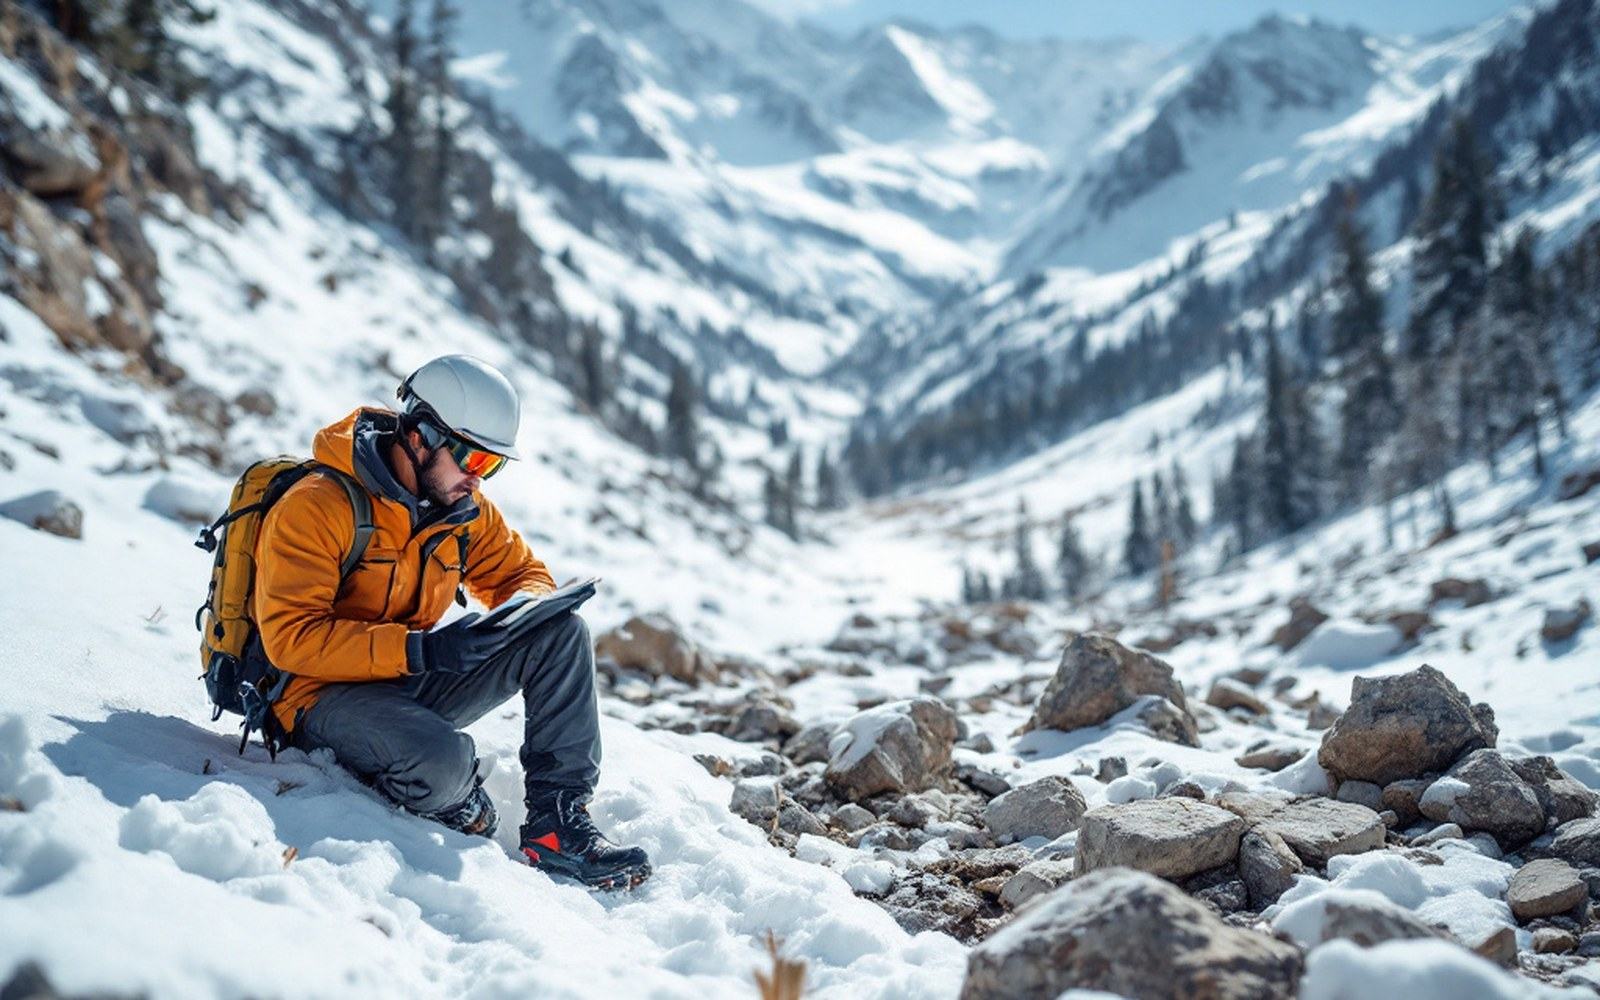
The pillow does one thing and does it well, but the network has gaps, and the gaps are where the snow course comes in. A snow course is a fixed transect — a line of measurement points established at the same location, walked at the same time each year, usually in late August or early September when accumulation is near its peak. A technician drives to the trailhead, puts on skis or snowshoes, and walks the course with an aluminium sampling tube, driving the tube into the snowpack at each marked point and reading the depth off the barrel. The tube is weighed, the weight divided by the area, and the result is another water-equivalent figure. Manual, slow, dependent on roads being passable and staff being available — but it generates a long, comparable time series that a sensor installed last decade cannot replicate.
Both methods feed into the same archive. Argentina's Subsecretaría de Recursos Hídricos publishes annual snowpack bulletins drawing on pillow data, snow-course records and river-flow projections for the major Andean basins. The bulletin is read carefully by irrigation administrators in Mendoza, hydroelectric planners and, downstream in both directions, by anyone whose summer water supply depends on what melted off the range in October.
From the field notes
Key instruments
- Snow pillow
- fluid-filled bladder under the snowfield; measures water equivalent by pressure, transmits remotely
- Snow course
- fixed transect walked annually; tube sampling at marked points, manually weighed
- Snow water equivalent (SWE)
- the water volume stored in the snowpack column; the figure both methods produce
The calendar and the correction
The late-August measurement date is not arbitrary. It falls close to the statistical peak of accumulation across the central Andes — after the main Pacific storm window has largely closed, before melt has meaningfully begun. A reading taken then gives a ceiling figure, an upper bound on what the season will yield. If the number is low, water managers begin adjusting allocations in September. If it is high after a succession of lean years, the figure is checked against the instrumental record before anyone claims recovery.
What complicates both methods is the zonda — the dry, warm foehn wind that comes off the lee of the range and can remove centimetres of water equivalent from a snowpack in a single afternoon. A pillow captures that loss in real time; a snow course taken three days after a zonda event captures only what survived. The bulletin notes these events where they are documented, and long-running courses build enough statistical mass to absorb the noise — but a single anomalous year remains ambiguous until the river gauges tell their part of the story in spring.
Sastrugi — wind-sculpted ridges and hollows carved into the snow surface — can also frustrate a point measurement. A sampling tube driven into a sastrugi trough reads thin; one driven into the crest beside it reads deep. Experienced field technicians walk the course deliberately, selecting the same representative spots year after year, which is why continuity of personnel matters almost as much as continuity of location. The archive is only as comparable as the person reading it remembers to make it.
From the field notes
What the data is actually for
- Irrigation allocation
- Mendoza-basin administrators read August bulletins before adjusting seasonal water quotas
- Hydroelectric planning
- reservoir operators use melt projections to schedule generation
- River-flow forecasting
- spring gauge readings cross-check the snowpack estimates made in August